Which Firefox tab’s rogue Javascript is hogging the CPU ? Here is the answer…
Chrome isolates the content of each domain’s tabs in a separate process – which lets the user manage each of them with the operating system’s native process management tools. Firefox does not – so when it starts hogging 100% CPU, users are clueless.
Among the usual suspects is Flash, but Flash is innocent on my workstation’s Iceweasel : I entirely removed any Flash interpreter from it and I am now clean from this filth.
Next in the suspect row is misbehaving Javascript, unless you are my friend Lerouge and surf with NoScript buttoned-up. But how to identify it ?
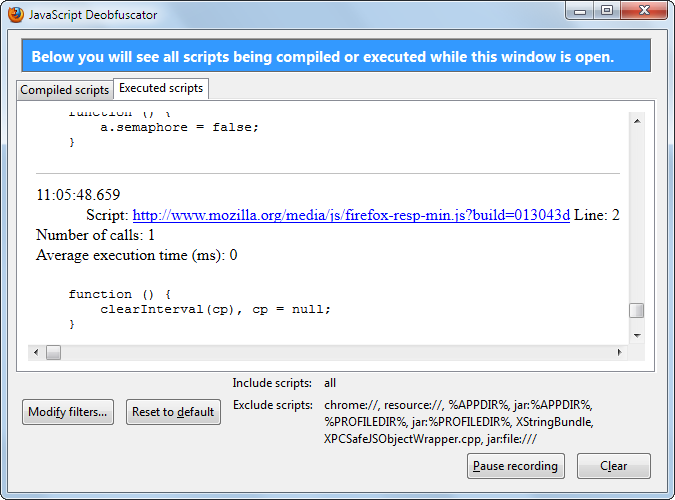
As I expected, the answer was awaiting me among debugging tools – but it took longer than I estimated because it laid in the misleadingly named Javascript Deobfuscator extension… It does deobfuscate somewhat but as a commenter suggested it should really be named Javascript Execution Monitor because its major value addition is actually telling you what runs and when.
In the Javascript Deobfuscator dialog’s second tab, watch the “Number of calls” field – that is all you need. It is not a direct measure of CPU usage, but a close enough proxy : find the function with a runaway number of calls and you will likely have caught the culprit.
And that’s it – Iceweasel’s CPU usage is back to near zero, where it belongs. In my case, among the ocean of open tabs in on my virtual desktop’s many open windows, the culprit was this page to whose incompetence I grant some Pagerank as a token of appreciation for having led me to discover a solution to this problem !
Now, what I would love the Javascript Execution MonitorDeobfuscator to acquire is a list of the top call rates, by page and by script – updated every second. Make that a separate extension and call it the Javascript Execution Monitor !
One response to “Which Firefox tab’s rogue Javascript is hogging the CPU ? Here is the answer…”
Leave a Reply to jerome Cancel reply
You must be logged in to post a comment.
And how is that supposed to help? I get an unsorted list of hundreds of scripts, without any information on what tab they’re running.
Furthermore, there’s no way to sort for number of calls, so finding the most-called script is scrolling a very long randomly-sorted list.
What didn’t I understand?